What Are the Different Types of Analytics?

When I first started in this field, I was ignorant. I had no idea that there were different types of analytics. It was about two years into this field that I came across it. I wished I had known sooner. It's given me clarity on my continuing analytics journey and allowed me to see the analytics progression my company is making.
In this blog, I will talk about the four types of analytics, what they are, their use cases and how they work together.
The four types of analytics are: Descriptive, Diagnostic, Predictive and Prescriptive. Each type adds a different amount of value to an organization. The more value-added, the more complex it is to implement. The chart below illustrates this relationship.
Descriptive Analytics
What happened?
As the name suggests, Descriptive analytics describes what happened in the past by summarizing historical data, usually in dashboards and reports. The aim is to provide an easily digestible snapshot.
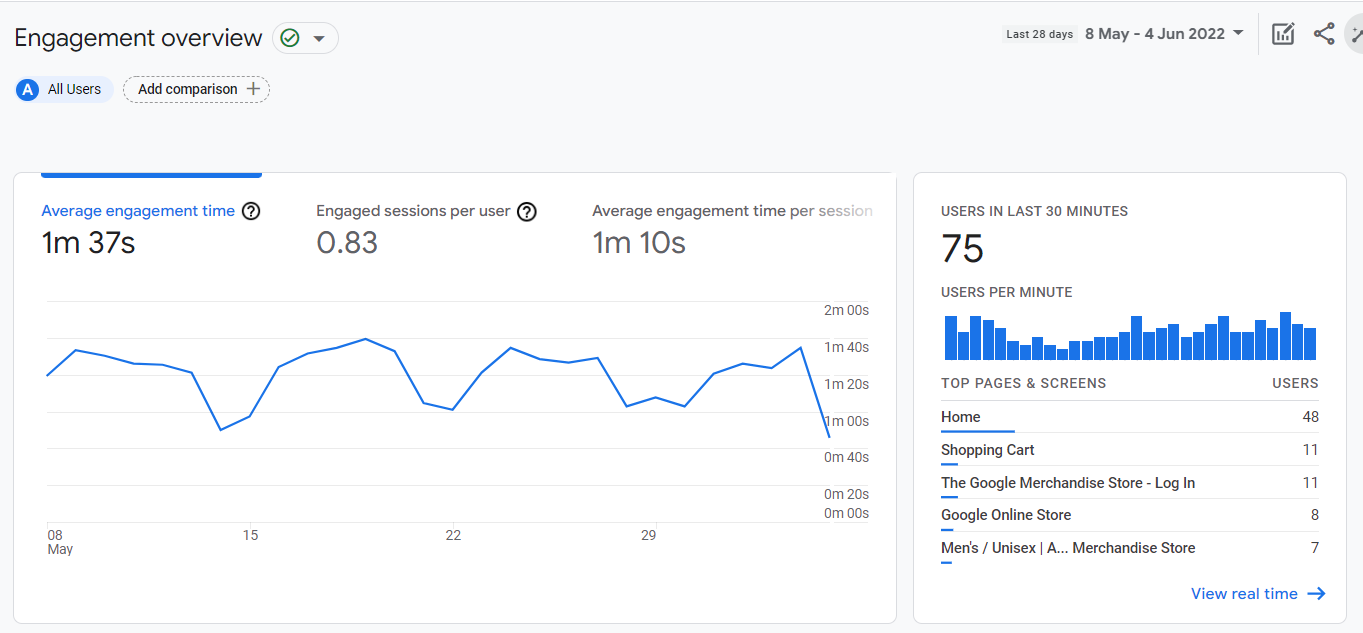
It is the most straightforward and most commonly used analytics in business today. It is foundational to the other three types. Its most extensive use is to track Key Performance Indicators (KPIs), which are quantifiable measures that gauge a company's performance against set goals. An example of descriptive analytics in action is Google Analytics.
The image below is a screenshot of demo data. It provides an overview of the users' engagement with the website, showing you metrics like the average engagement time and what that looks like over time.
Diagnostic Analytics
Why did it happen?
Following Descriptive Analytics is Diagnostic Analytics. Once you understand what happened, you want to delve deeper and explore why it happened.
Continuing with the example of Google Analytics, if we see a continuing decline in average engagement time, we'll want to find out what's driving it. We could drill down to understand when the fall started using time series analysis and explore to see if there is a particular page or group of pages contributing to the decline. To get to the root cause, you'll need to bring in additional data sources that might offer further insight.
Diagnostic analytics isn't all about addressing problems; it could be used to understand what's driving positive results. For instance, if the sales for one of your products have gone through the roof in the current month compared to previous monthly sales, you'll want to look into it. From drilling into your data, you ascertained that the spike is due to an influencer mentioning your products on Facebook.
Several techniques can be employed when running diagnostic analytics, such as drill-down, regression analysis, time-series analysis and correlations.
Predictive Analytics
What is likely to happen?
Predictive Analytics is a step up from Diagnostic Analytics, a form of advanced analytics. Advanced analytics is an umbrella term used to describe analytics that uses sophisticated technology and high-level methodology such as advanced statistics.
Predictive Analytics builds on what happened and forecasts what is likely to happen using historical data. Predictive models estimate the likelihood of a future event or outcome based on past patterns and trends identified from the input data. It's valuable to a business as it enables future planning.
Examples of business applications include sales forecasting and risk assessment. With a sales forecast, you might want to use a correlation between seasonality and sales to predict when sales are likely to drop and implement a promotional campaign to counteract that seasonal dip.
Risk assessment is a common application in the financial industry. You might want to use a predictive model to assess the probability of a given customer defaulting on their payments. They can be classified into one of two categories: "will default" or "will not default". The company can quickly assess whether the customer is a good candidate for a credit card with that information.
Predictive analytics is used to forecast all sorts of future outcomes. It's not 100% accurate, but it minimizes guesswork.
Prescriptive Analytics
How will it happen?
Prescriptive Analytics is the last type of analytics. It combines insight from all previous analyses to determine what action to take next. In other words, it shows you what steps to avoid a future problem, what can be done to capitalize on emerging trends etc.
Prescriptive Analytics is the most complex type of analysis. It involves utilizing state-of-the-art technology and data practices such as machine learning, neural networks, statistical methods, computational modelling procedures etc.
A prescriptive model looks at all the possible decision patterns or pathways a company might take and the likely outcome. Knowing the possible scenarios and potential outcomes from each scenario, the company can decide the best option or action to take.
An excellent example of prescriptive analytics many of us are familiar with is Google Maps. When figuring out the optimal way to get from A to B, Google Maps considers many parameters, like transport mode (public transport, walking, driving etc.), current traffic conditions, possible road works, and tolls to calculate the best route.

That is the end. As you can see, each type of data analysis is connected and intertwined with one another to a certain degree. Each type of analysis serves a different purpose. Moving from descriptive analysis to more advanced analysis types like predictive and prescriptive requires much more technical ability, but the return and insight unlocked are also far more remarkable.