Time Series Data and Time Series Analysis

In the last few years, I started paying attention to my health and fitness. One of the things I pay close attention to is my sleep. My Oura Ring tracks my sleep. Of the resources I've gleaned, quality sleep is one of the best performance enhancers, and it's all au naturale!
Do you want to take a look at my sleep metrics?
Here are weekly time series line charts of my REM and Deep Sleep from 1st January to 11th June 2023. Sleep consists of different stages. REM and Deep Sleep are two of the sleep stages.
For reference, healthy adults typically have around 1.5 hours of REM sleep, which decreases with age. On average, adults spend 15-20% (1-1.5 hours) of their total sleep time in deep sleep. However, I aim to increase REM and deep sleep to 2 hours each per night.
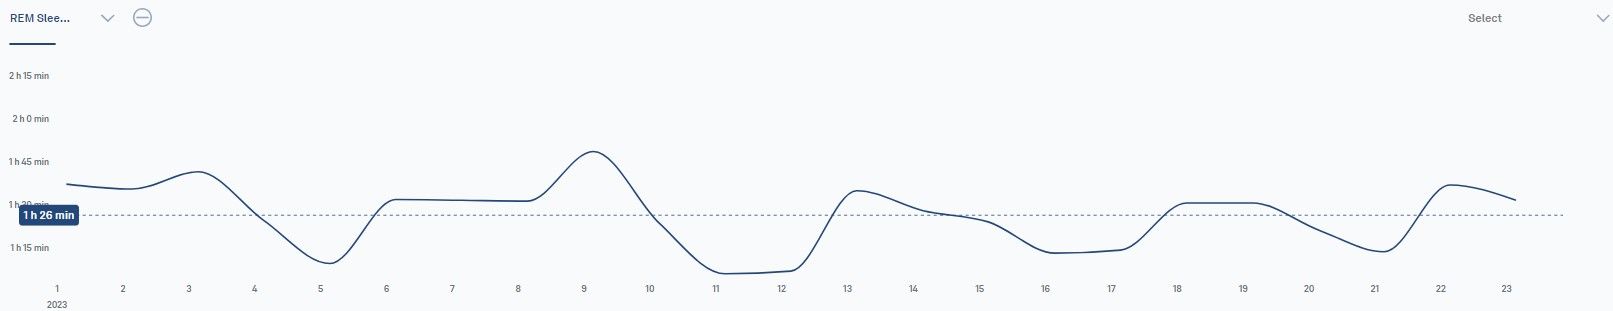
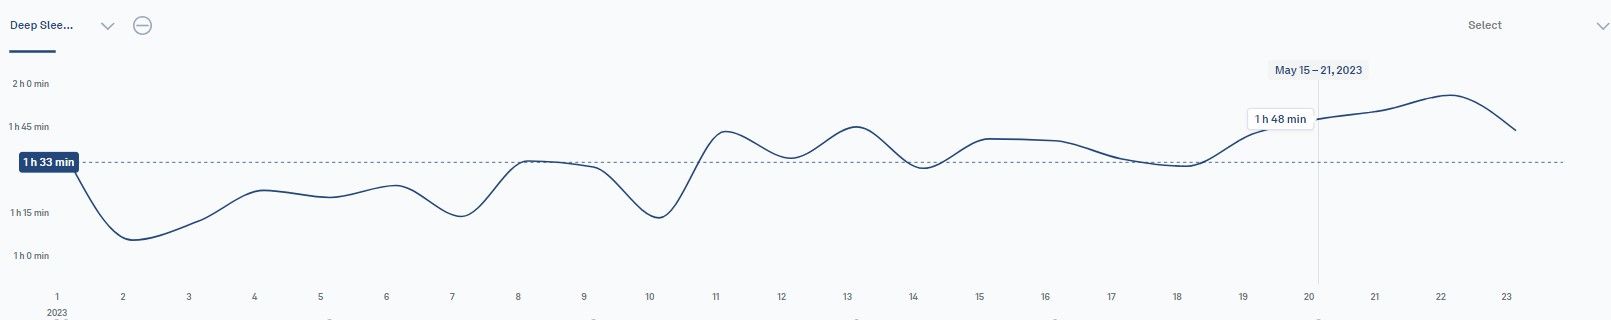
Examining the two charts, I see the amount of REM sleep is dipping slightly, and deep sleep is increasing. Looking at the 20th to 22nd week of 2023 (15th May to 4th June), can you guess why my deep sleep has gone up?
I'll share the answer later.
What we are looking at here are time series datasets. Time series data and its analysis are increasingly important due to the massive production of such data through, for example, the Internet of Things (IoTs), the digitalisation of healthcare, and the rise of smart cities. Apart from data professionals, I think anyone working in a role that necessitates making decisions and planning policies can greatly benefit from understanding time series data and analysis. Time series analysis helps businesses make better business decisions.
In this blog, let us explore the following:
- What are Time Series data and Time Series Analysis?
- The Components of Time Series
- What is Time Series Analysis used for?
- What are the Common Use of Time Series Analysis in Business?
- Time Series Analysis Tools
What is time series data and time series analysis?
Time series data is simply information collected in a particular order over time. This could be anything like daily sales in a store, hourly temperature readings, or even the yearly population of a city. As conveyed in the name, the key idea is that time is an important aspect and the order of data matters.
Now, let's talk about time series analysis. Let's continue with my sleep example. REM is a sleep stage I monitor. REM sleep is associated with dreaming, memory consolidation, and creativity. It plays a vital role in reenergizing your mind and body. Suppose I want to answer questions like "Is my REM sleep longer on the nights when I burn more calories during exercise?" Or "Is there a difference in my REM sleep between winter and summer?"
To answer the two questions, I need to go through my REM sleep data, identify patterns, and draw conclusions.
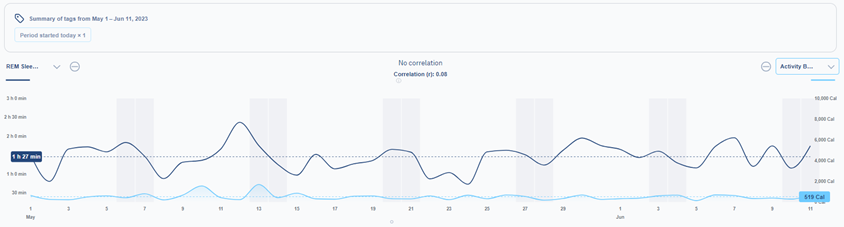
As you can see from the line chart above, the analysis reveals that there is no correlation between burning more calories during exercise and longer REM sleep. The correlation value is 0.08, indicating a negligible relationship. Correlation ranges from -1 to 1, where -1 signifies an inverse relationship, 1 indicates a positive correlation, and values close to 0 indicate no correlation.
Based on this analysis, it's clear that working out harder does not lead to increased REM sleep. I guess I need to find other ways to improve my REM sleep.
The Components of Time Series Data
Any time series dataset can have one or more of the following four components:
Trend: A trend represents a long-term and consistent movement in a series, either upward or downward. It may not be immediately noticeable and can be unexpected. For example, if a company's stock price steadily increases over several years, it exhibits an upward trend. On the other hand, if the demand for a particular product declines steadily, it shows a downward trend.
Cycle: A cycle involves repetitive patterns of ups and downs that occur around a trend. Unlike seasonal variations, cycles do not follow a fixed and predictable time frame. For instance, the housing market experiences cycles of booms and busts, where periods of increasing prices are followed by declining prices.
Seasonality: Seasonality refers to recurring patterns that happen at fixed intervals within a year. These patterns are associated with specific seasons or time periods. For example, retail sales often exhibit seasonality with higher sales during holiday seasons like Christmas or Black Friday.
Irregularity: Irregularity, also known as noise, represents random and unpredictable variations in a dataset. It is what remains after removing trends and seasonal patterns. For instance, sudden spikes or drops in stock prices due to unexpected events or news can be considered irregularities.
By understanding and identifying these components within a dataset, we can make adjustments and improvements to perform more accurate forecasting. For example, by removing the seasonal effects from sales data, we can better predict the underlying trend and make informed business decisions.
What is Time Series Analysis Used For?
The use of time series analysis can be broadly grouped into one of the three:
-
Make decisions about future values, based on past values. For example, you could set swimsuit retail prices based on seasonal variations in time series data.
-
Forecast future values, based on past values. For example, you could forecast general temperature based on decades of weather records.
-
Pinpoint irregularities or noise in time series. For example, you could detect fraudulent financial activity based on historical financial activity.
What are the Common Use of Time Series Analysis in Business?
Time series analysis plays a crucial role in business by providing valuable insights into historical patterns and trends. It involves analysing and modelling data points collected over time to understand the underlying dynamics and make accurate predictions for the future. Here are five common uses of time series analysis in a business setting:
Sales Forecasting: Businesses use time series analysis to forecast future sales based on historical data. Accurate sales forecasting enables effective resource allocation, production planning, inventory management, and overall business strategy.
Demand Planning: Time series analysis helps businesses anticipate and plan for fluctuating customer demand. Businesses can optimise their supply chain, manage inventory levels, and ensure customer satisfaction by analysing historical sales data and considering factors such as seasonality and trends.
Financial Analysis: Time series analysis is widely used in finance and accounting to analyse financial data and predict future trends. It aids in analysing stock prices, exchange rates, interest rates, and other financial indicators, allowing businesses to make informed investment decisions and optimise financial performance.
Marketing Campaign Analysis: Businesses utilise time series analysis to assess the effectiveness of marketing campaigns over time. Businesses can optimise their marketing strategies, allocate budgets more efficiently, and improve campaign performance by analysing data on campaign launches, customer responses, and sales.
Customer Analytics: Time series analysis is applied in customer analytics to understand customer behaviour patterns over time. Businesses can identify trends, seasonality, and preferences by analysing customer data. This helps personalise marketing strategies, optimise customer segmentation, and enhance customer retention and satisfaction.
These applications of time series analysis empower businesses to make data-driven decisions, optimise operations, and achieve their goals in a dynamic and competitive business environment.
Time Series Analysis Tools
There are several tools and software available to implement time series. Below are some widely used tools. I use Excel and Tableau, but I have on my short-term learning list to use Python in time series analysis.
R: R is a popular programming language for statistical computing and graphics, offering packages such as "forecast," "tsibble," and "tseries" designed for time series analysis. It provides comprehensive functions and tools for data manipulation, visualisation, modelling, and forecasting.
Python: Python is a versatile programming language with libraries like "pandas" that support time series analysis. Libraries like "statsmodels" and "scikit-learn" offer advanced statistical modelling and forecasting capabilities.
MATLAB: MATLAB is a programming language widely used in scientific and engineering fields, including time series analysis. It provides various functions and toolboxes dedicated to time series analysis, such as the "Econometrics Toolbox" and the "Financial Toolbox." MATLAB offers powerful visualisation and modelling capabilities.
SAS: SAS (Statistical Analysis System) is a comprehensive software suite that includes features for time series analysis. SAS offers specialised procedures and tools like "PROC ARIMA" and "PROC TIMESERIES" for analysing, modelling, and forecasting time series data.
Tableau: Tableau is a data visualisation tool widely used in business. While not specifically designed for time series analysis, Tableau offers capabilities to explore and visualise time series data effectively. It allows users to create interactive dashboards, charts, and graphs to analyse and present time series insights.
Excel: while not specifically designed for time series analysis, Microsoft Excel can be used for basic tasks. It provides functions like moving averages, exponential smoothing, and regression analysis, which help analyse trends and patterns in time series data. Excel also offers visualisation capabilities for creating charts and graphs.
To close, time series data and analysis provide valuable insights for making informed decisions in various fields.
Quickly, let's revisit my data on sleep. During the 20th to 22nd week of 2023, my deep sleep increased. Deep sleep is vital for body repair and immune function. I believe the increased amount was due to removing two wisdom teeth on 20th May. My body knew more deep sleep was needed for the healing process.
So, I hope you now understand and appreciate time series data and analysis better. By leveraging its power, we can make better decisions, optimise our activities and achieve our goals.