Territory Planning for a Launch Brand
Disclaimer
This case study is provided for portfolio demonstration purposes only. The brand and commercial scenario are fictional. The analysis uses a combination of synthetic data and publicly available aggregate sources to illustrate territory planning methodology. No proprietary or confidential company data has been used or disclosed.
1. Commercial Context
This is an illustrative case study looking at territory planning for a specialist-initiated therapy at launch.
Ricardis is a newly PBS-listed oral therapy indicated for patients with chronic kidney disease (CKD) associated with type 2 diabetes. The goal of treatment is to slow disease progression and reduce cardiorenal events like strokes, and heart attacks.
Treatment initiation is specialist-led. Nephrologists, cardiologists and endocrinologists identify eligible patients and commence therapy. Referrals typically begin in primary care, but prescribing decisions sit with specialists. Once patients are stabilised, patients may transition back to GP management.
Initial launch planning determined that a national field force of 10 territories would support this model.
The purpose of this case study is to show how to create sales territories that are reasonably equal in commercial opportunities and workload, while still making geographic sense.
2. The Question
With 10 territories established and no sales history available, how should Australia be divided to balance:
- Commercial opportunity
- Representative workload
- Geographic practicality
In other words: how do we avoid overloading some representatives while under-utilising others?
3. The Approach
Balancing territories is not simply about dividing the map evenly. It requires aligning three elements:
- Commercial opportunity
- Representative workload
- Geographic logic
At launch, we infer this through use of various proxy data and business specialist inputs such as your sales leaders.
3.1 Estimating Opportunity
With no Ricardis sales history, opportunities was modelled at postcode level using the following indicators:
- Analogue market sales (prescribing behaviour signal)
- Specialist distribution (prescribing access + expected engagement effort)
- NDSS Type 2 registrations (underlying patient potential)
Each serves a different purpose in the model.
Analogue Market Sales
In real commercial environment, analogue IQVIA sales data is typically available at brick level and would need to be aligned to postcode to support territory modelling.
For this illustrative case study, a synthetic postcode level analogue sales data was constructed to reflect realistic geographic prescribing variation.
Specialist Distribution
The three key specialists relevant to Ricardis are: nephrologists, cardiologists
and endocrinologist.
The postcode distribution influences both opportunity and workload. Weighting was applied based on relative clinical relevance and commercial priorities:
- Nephrologist – 0.45
- Cardiologist – 0.30
- Endocrinologist – 0.25
NDSS Type 2 Registrations
The National Diabetes Services Scheme (NDSS) provides postcode-level registration data. This provides a proxy for underlying disease burden.
However, prevalence alone does not drive early launch uptake. Right specialists’ distribution and analogue sales history matter more in the short term.
For that reason, weighting was structured as follows:
- Market Analogue sales weighting of 0.45 assigned. Why? Observed prescribing pattern
- Specialist count weighting of 0.35 assigned. Why? Access + future growth
- NDSS Type 2 diabetes registration weighting of 0.2 assigned. Why? Underlying disease burdent. Patient potential.
All components were standardized and combined into a composite index calculated at a postcode level.
3.2 Structuring Territories
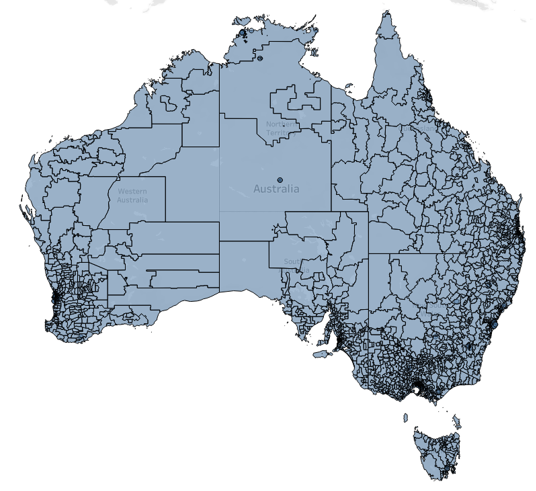
Once the postcode-level composite index was created, the next step was aggregation into 10 balanced territories.
Allocating postcodes manually would be inefficient and difficult to iterate (image1).
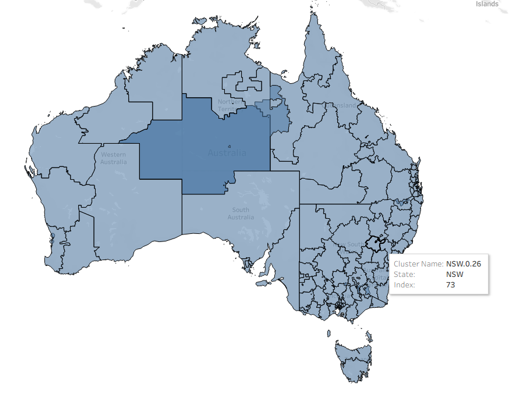
Instead, clustering algorithm was used to group adjacent postcodes into workable clusters (image2).
These clusters were then combined into territories while monitoring:
- Total composite index per territory
- Geographic coherence
- Expected travel burden
Importantly, territory design is not purely mathematical.
In practice, cluster outputs should be reviewed with sales leadership to sense-check practical travel flows, on-the-ground field intelligence and local nuances. Where required, adjustments would be made.
This keeps the structure data-informed while allowing space for commercial judgement.
4. The Outcome
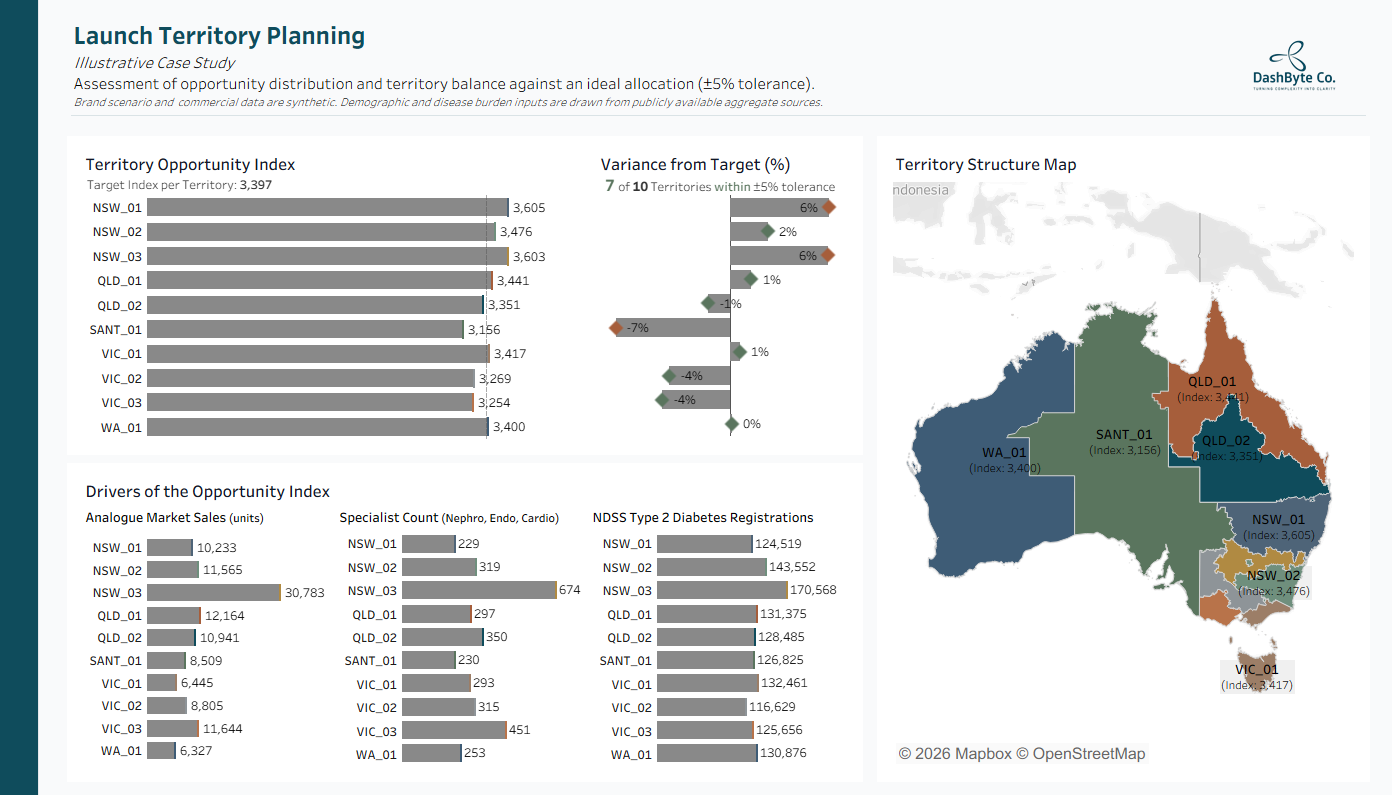
Territories were benchmarked against an ideal opportunity index of 3,397, representing an even distribution of the total national composite opportunity across 10 territories. A design tolerance of ±5% was applied.
Seven of the ten territories fall within this ±5% range, with all territories contained within ±7%.
The largest positive deviation is +6% (NSW_01 and NSW_03), while SANT_01 sits at -7%. These variances were retained to preserve geographic coherence and practical field execution rather than forcing mathematical symmetry.
The structure achieves commercially workable balance within an acceptable tolerance band.
If required, the clustering exercise could be re-run to test whether variance can be reduced further. However, tighter numerical balance does not necessarily improve field execution, so any refinement would need to remain operationally sensible.
The dashboard consolidates territory index, variance and underlying drivers in a single view, making allocation decisions transparent.
5. What Next
At launch, territory design relies on proxy signals. Over time, actual sales performance and engagement data provide a clearer picture of prescribing behaviour and workload distribution.
After 12 months, the model can be recalibrated using observed uptake, call intensity and performance variation across territories. Optimisation may then focus on different objectives such as rebalancing workload, accelerating growth in high-potential regions, or reallocating resources where performance diverges from expectation.
Territory structures should not be treated as static. Even routine reviews can help ensure alignment with evolving market dynamics, portfolio priorities and organisational changes.
In short, territory planning is not a one-off exercise, it is an ongoing discipline.
Reference
- Australian Bureau of Statistics (ABS) – Population and regional demographic statistics https://www.abs.gov.au/
- Australian Institute of Health and Welfare (AIHW) – Chronic disease and diabetes statistics https://www.aihw.gov.au/
- National Diabetes Services Scheme (NDSS), Australian Diabetes Map https://www.ndss.com.au/about-diabetes/diabetes-facts-and-figures/australian-diabetes-map/
- Tableau Sales Operations Territory Clustering example (TC19) https://github.com/hbarcello/TC19_TableauSalesOps
- GeoNames Postal Code Dataset (postcode centroid reference data) https://download.geonames.org/export/zip/