Power Query Part 1


If you don't already know, data preparation, including cleaning, is very labour-intensive. Since I've started blogging, I've said this many times, you're probably sick of hearing it, but hopefully, you get the message loud and clear. We spend too much time on repetitive manual work such as cutting & pasting, combining columns, applying filters and using complex Excel formulas to extract text from a column etc. Fortunately, there are plenty of ETL tools on the market to alleviate this burden. If you're new to analytics, Power Query is likely to be the first ETL tool you'll come into contact with. It certainly was mine. If you don't know or aren't clear on ETL and ETL tools, check out my blog: ETL, What is it?
I find Power Query easy to pick up. I think it's because I was already super comfortable and a relatively advanced Excel user. I would consider my Power Query skill to sit at the intermediate level. That said, I recall that even at a beginner level, I could reap many benefits just by applying the little I knew. It saved me so much time. I could easily shave up to 75-80% off time spent on complex data preparations using power Query compared to manual cleaning in Excel, sometimes even more.
In this blog, we will look at:
- What Is Power Query
- How to enable Power Query
- Three-part process of Extract, Transform and Load (ETL) in the frame of Power Query. I won't go into detail on the Transform step. I'll leave that for Part 2. There are heaps of wicked things to cover off.
What is Power Query
If it isn't apparent enough, Power Query is an application that allows you to import data from many different sources and clean, transform and reshape the data as needed. It is a lightweight ETL tool.
Power Query allows you to set up the required data preparation steps once and then reuse it with a simple refresh. It has an intuitive user interface. The Power Query editor records all data transformation step by step, just like a recorder, and converts it into the M code in the background. M code is the programming language of Power Query. Learning M language isn't required. You can achieve so much just by using the graphical interface alone.
How to Enable Power Query
Power Query is a Microsoft product. It seamlessly integrates into many popular Microsoft products, such as Excel, Power BI, and Power Automate. I'll focus on Power Query in Excel since it is the most widely used tool. Accessing Power Query in Power BI is done via Dataflow. I have little to no experience with Power Automate. I think it's not very common for people to use Power Query in Power Automate. Power Automate is a relatively new kid on the block, so I doubt there is a vast population acquainted with this app.
Now, back to enabling Power Query in Excel.
Power Query is available as a free add-in on Excel 2010 and 2013. It is free to download, but Microsoft is no longer updating it, so I recommend ditching it! Move to a later version. You're missing out on all the cool new features that will improve your life!
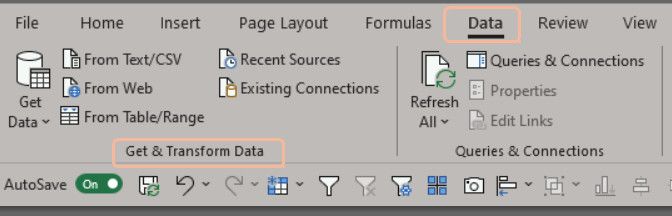
Power Query is a built-in tool starting with Excel 2016. It is part of the Get & Transform Data section in the Data ribbon.
Power Query Three-Part process overview
1. Extract/ Get Data
Importing data is straightforward. Head to the Data ribbon and navigate to the Get & Transform Data section.
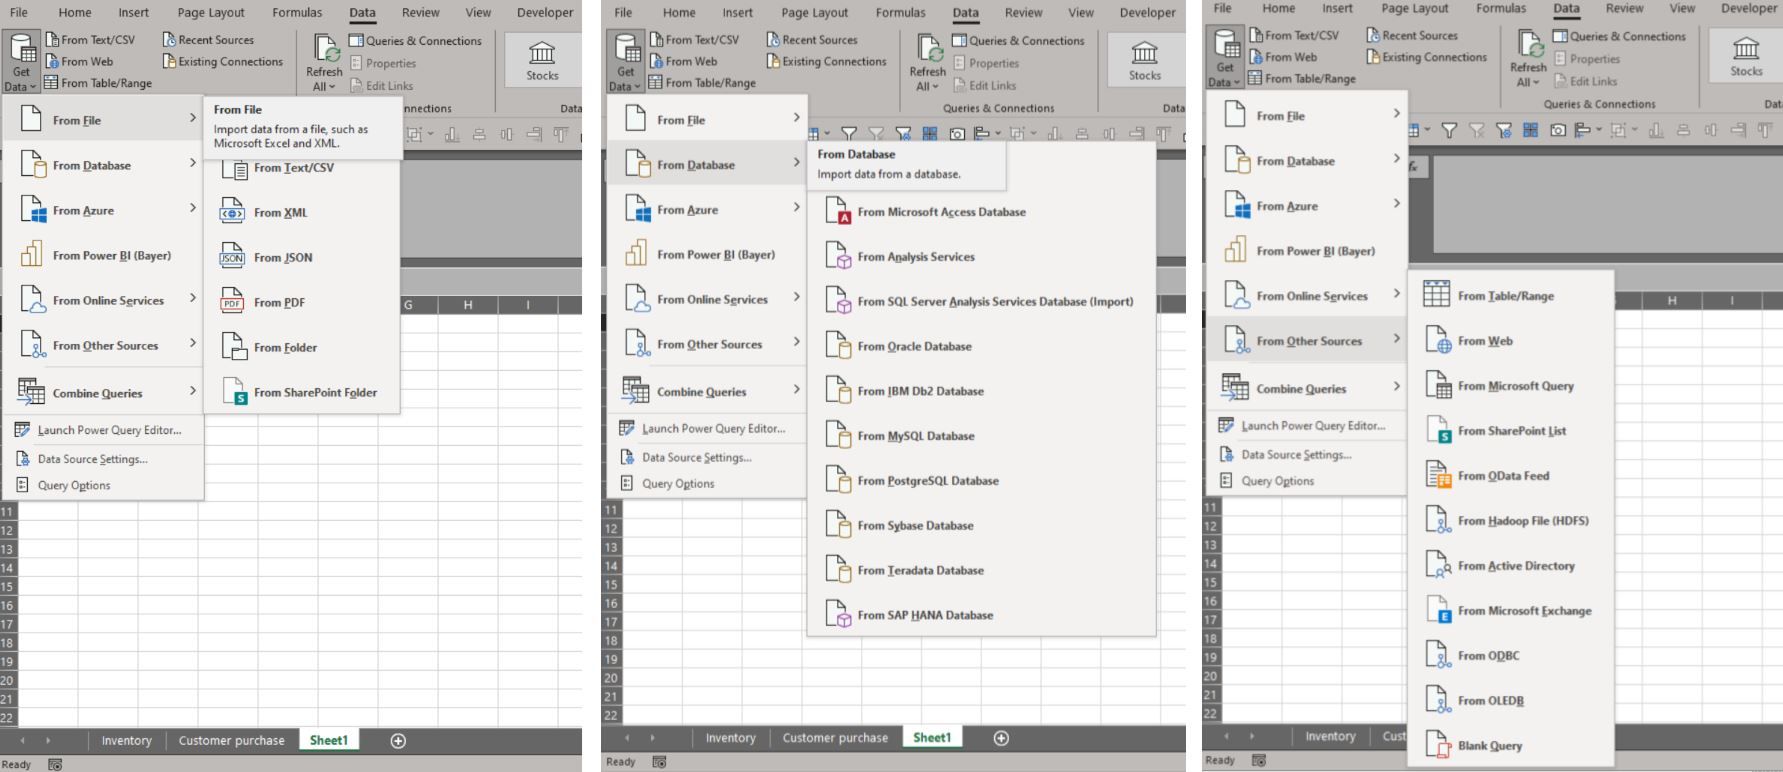
You can import data from several sources:
- From Files: importing files such as Excel, XML, CSV, PDF and JSON files
- From Databases: importing from databases like SQL Server, Microsoft Access, SQL Server Analysis Services.
- From Other Sources: importing from other sources like SharePoint, Excel Tables/ Ranges, Web, Microsoft Query
The source I use most is From Files.
2. Tranform Data
After connecting and importing the data, you can transform and clean the data into the shape you need for your analysis. Let's look at the Power Query editor and understand its different components. In the next blog, we will dive into the transforming features.
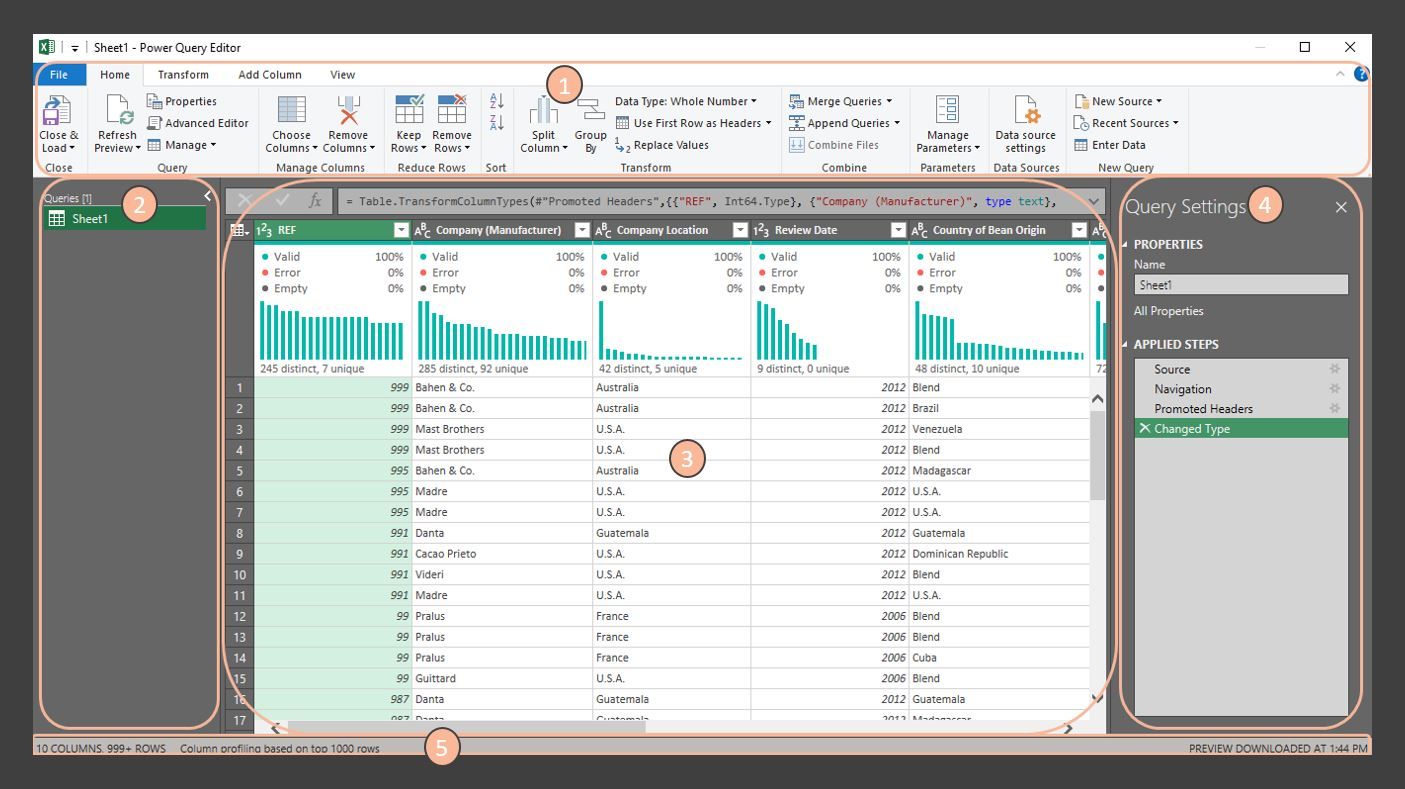
1. Ribbon: similar to the Excel interface. Here you'll find various commands organized across multiple tabs. The commands will allow you to add transforms, select options for your query and numerous other functions to help you prepare your data.
2. Queries pane: all your queries are visible here.
3. Current view (Data view): this is the main working view. It displays a preview of the data based on the current transformation step. Various transformation commands are available by right-clicking on the column header or clicking on the respective column header's filter option.
4. Query Settings: this is a view of the currently selected query with relevant information such as Query name, and Applied (transformation) Steps. In the Applied Steps subsection, you can add, remove, edit or reorder the steps if required.
5. Status Bar: it displays helpful information about your query, such as the number of rows.
3. Load Data
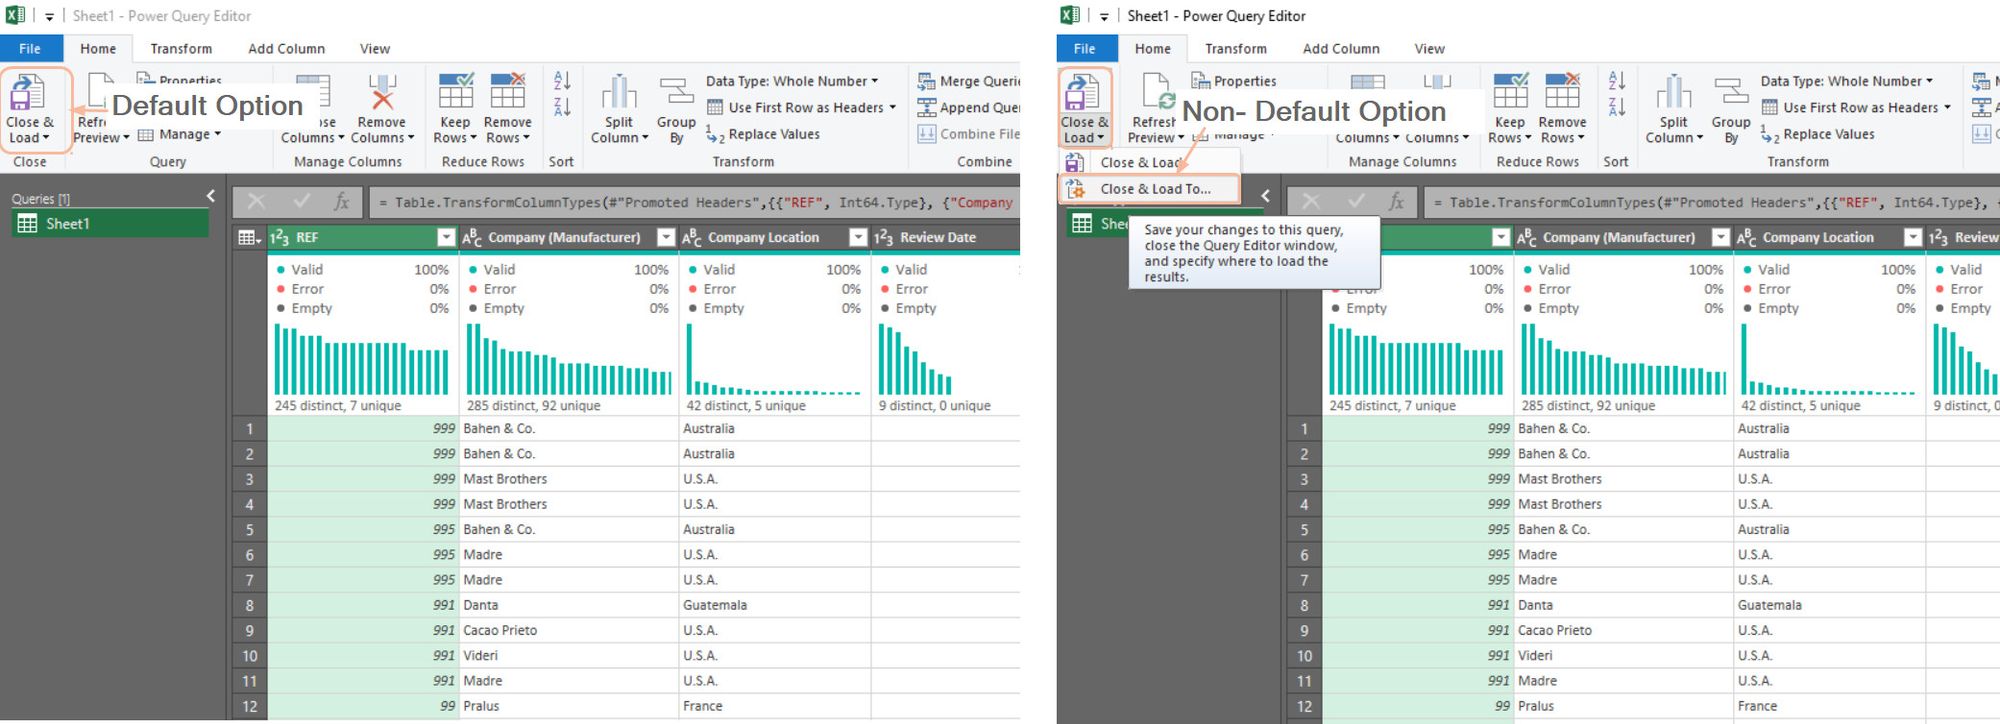
Once you've made all your transformations, you must decide what to do with that query. You cant leave the data in Power Query. It needs to be loaded to a destination.
If you choose the default option, by clicking Home > Close & Load, the data will be pushed into Excel as a Table on a new worksheet.
The non default options requires you to select Home > Close & Load (drop down) > Close & Load To…
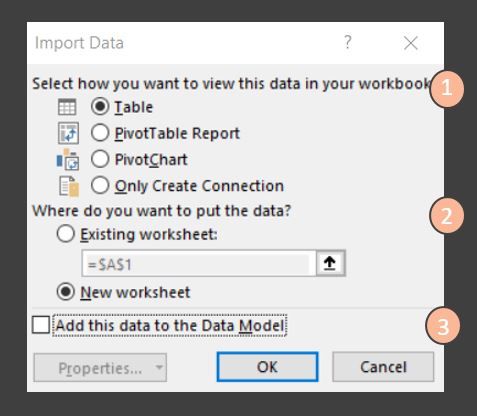
This then opens up the Import Data window, which provides three choices:
- How to view the data
- Where to put the data
- Whether to load the data into the Data Model
Let's quickly have a look at each of these options in turn.
1. How to view the Output
There are four options:
- Table: load the data into Excel as a Table, which appears on a worksheet.
- PivotTable Report: the fields (columns) of the transformed data are available to use in PivotTable.
- PivotChart: the fields (columns) of the transformed data are available to use in PivotChart.
- Only Create Connection: the data isn't visible on any worksheet. You may be wondering, isn't this pointless? It's not. I use this option a lot. There are queries I build as an intermediary, and I don't want it to show and clutter the workbook, so I only have it as a connection.
2. Where to Place the Output
Where to place the output is only relevant if you select Table, PivotTable or PivotChart as your choice to view the output.
We have two options here:
- New worksheet: the output will start at cell A1
- Existing worksheet: this is where you get to specify the exact cell to place the Table, PivotTable or PivotChart
3. Add to the Data Model
Data Model is a modern way for Excel to handle data. Think of an Excel Data Model like a relational database or even a black box where you can store data, and Excel will quickly provide answers to you. When you load data to the model, it can compress the file size compared to loading it as PivotTable. To give you an idea, if you load 1 million rows of data with two columns into the Data Model and then use the Data Model to create a PivotTable, the file size would be around 800 KB. In contrast to loading the same data directly into the PivotTable, the file size would be about 3500 KB. That's over quadruple the size!
I hope I haven't overwhelmed you. Power Query may initially seem overwhelming, but I assure you, it's not. Many concepts you see in Power Query should be familiar to Excel users. If you're not familiar with Excel, my recommendation is to hold off learning Power Query until you are familiar and comfortable with Excel.
That's it for now. Next time we will spend more time on the Transform Data step of Power Query, where all the action sits! Ciao for now.